


GAT Solutions
Our own numbers · Consulting · Our own property
The clearest example we have of effort and search movement landing in the same month, because we can show both sides.
Visit the live site →Before we changed anything
- •A site averaging one to three changes a month and almost no search presence
- •Pages competing with each other for the same intent
- •Metadata over the limits, and canonical paths inconsistent
What we built
- ✓103 commits in July 2026 alone, against one to three a month before it
- ✓De-cannibalised overlapping pages so one intent has one owner
- ✓A full metadata, canonical and internal link pass
- ✓Crawl paths opened where consolidation had closed them
What search did over the same period
| Month | Impressions | Clicks |
|---|---|---|
| March 2026 | 23 | 0 |
| April 2026 | 76 | 2 |
| May 2026 | 43 | 3 |
| June 2026 | 125 | 0 |
| July 2026 | 746 | 18 |
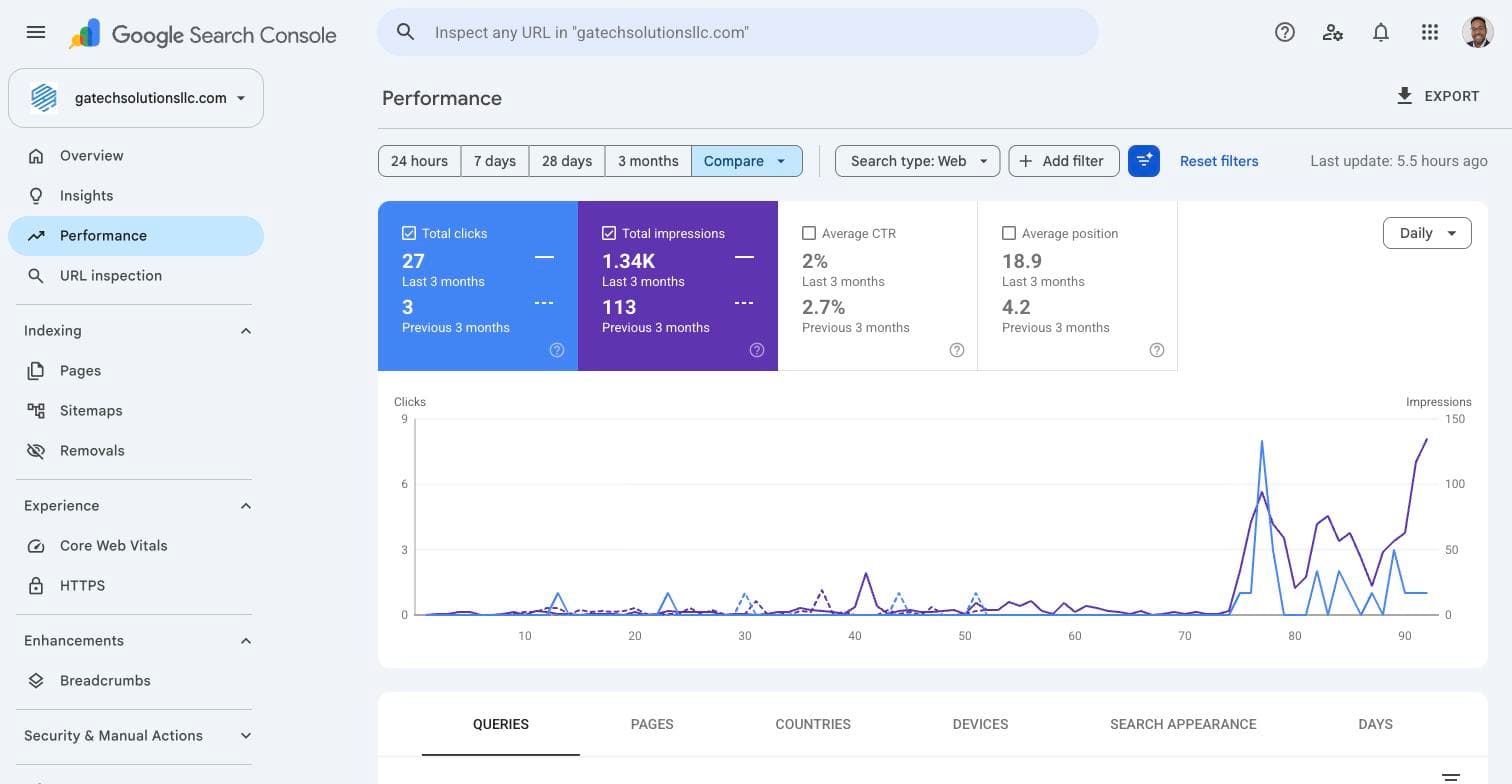
Google Search Console alongside the commit history for the same period. Both are independently checkable, which is the only reason we are willing to put them next to each other.
The receipts
What we are not claiming
One to three commits a month from March to May, then 103 in July, and impressions went from 125 to 746 in that same month. That is a correlation on a site we control, not proof of causation, and the absolute numbers are small. We are showing it because both the work and the result are verifiable, which is more than anyone else in this market is willing to put on a page.